Weekly Technical Analysis - Week 2
Weekly Technical Analysis. Week 2 2022.

$DJI
Dow Jones Industrial Average
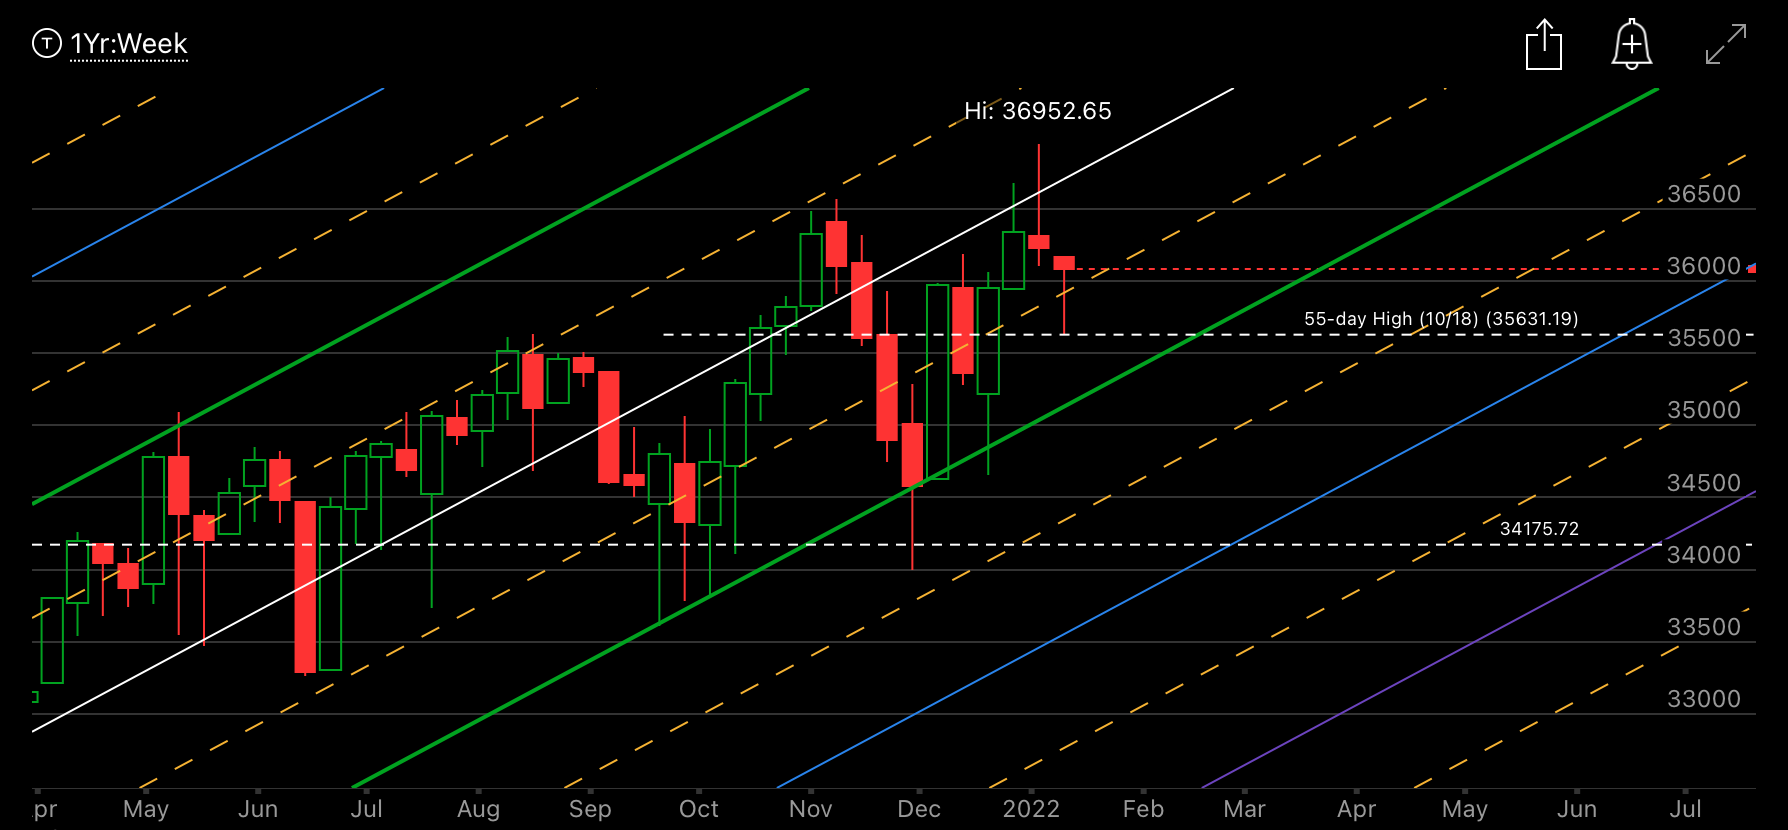
- It has been a tumultuous times last week with the release of the fed's meeting minutes. I am certain it felt brutal to those investors with growth stocks in their portfolios.
- $DJI retested the long term 55-day high of 35631.19 this week.
- An investor can speculate a modest turn-around this week.
NDX
Nasdaq-100 Index
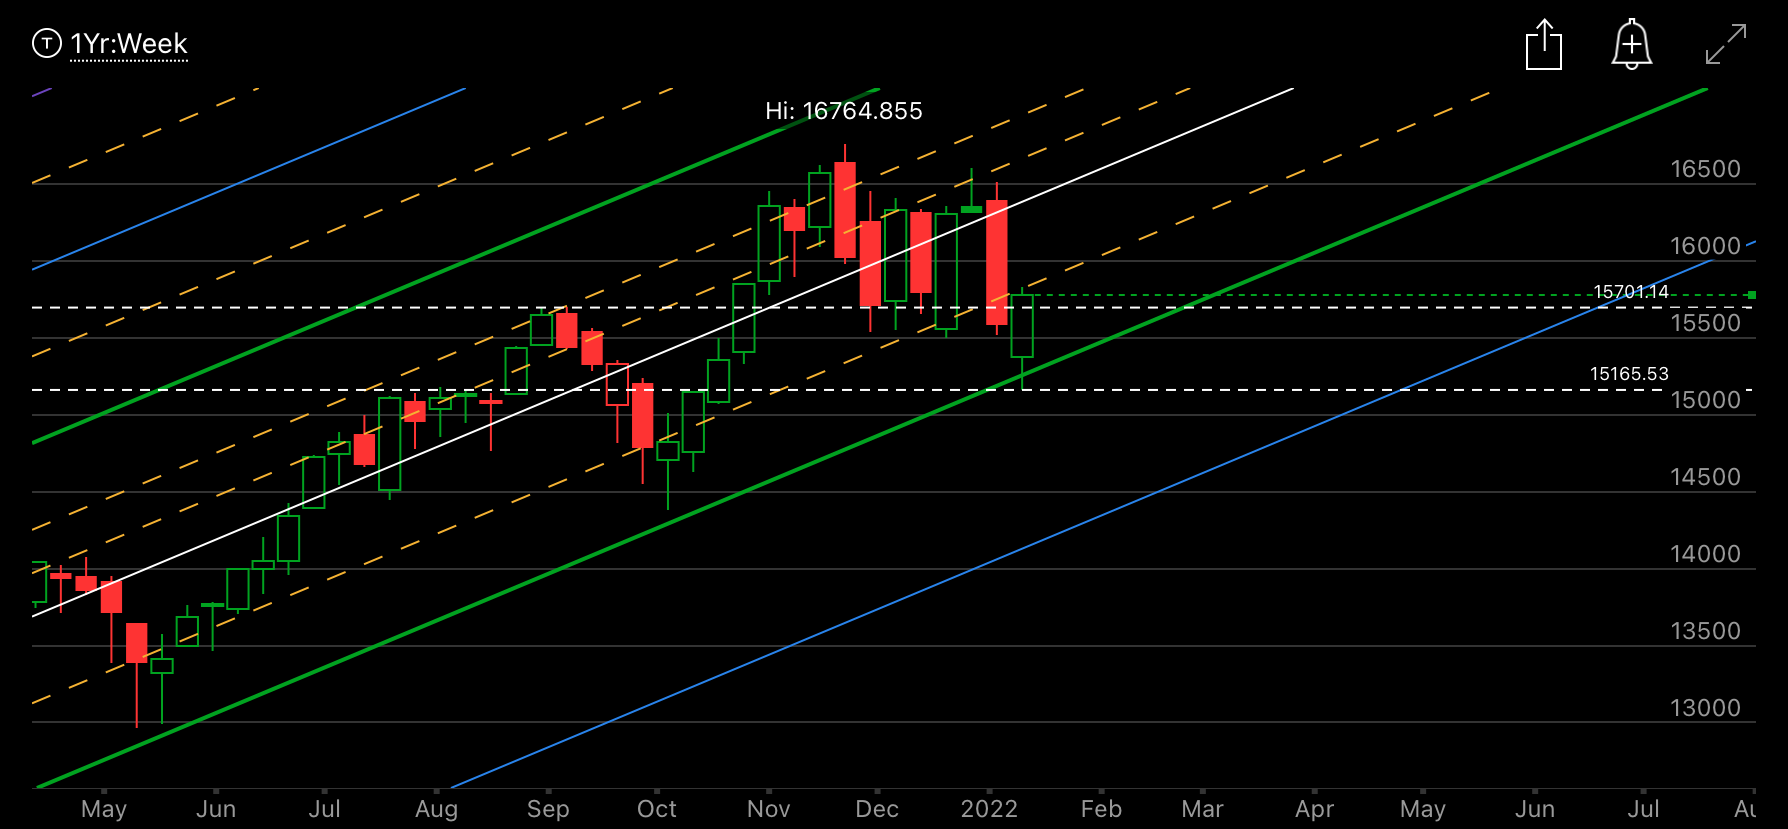
- $NDX also retested a long term resistance of 15165.53 this week.
- It seems to bounce off the 1 standard deviation line.
- An investor can speculate the rate hikes effect has done enough for now. And, with this in mind, one can be bullish again on the growth stocks. Proceed with caution.
RUT
Russell 2000 Index
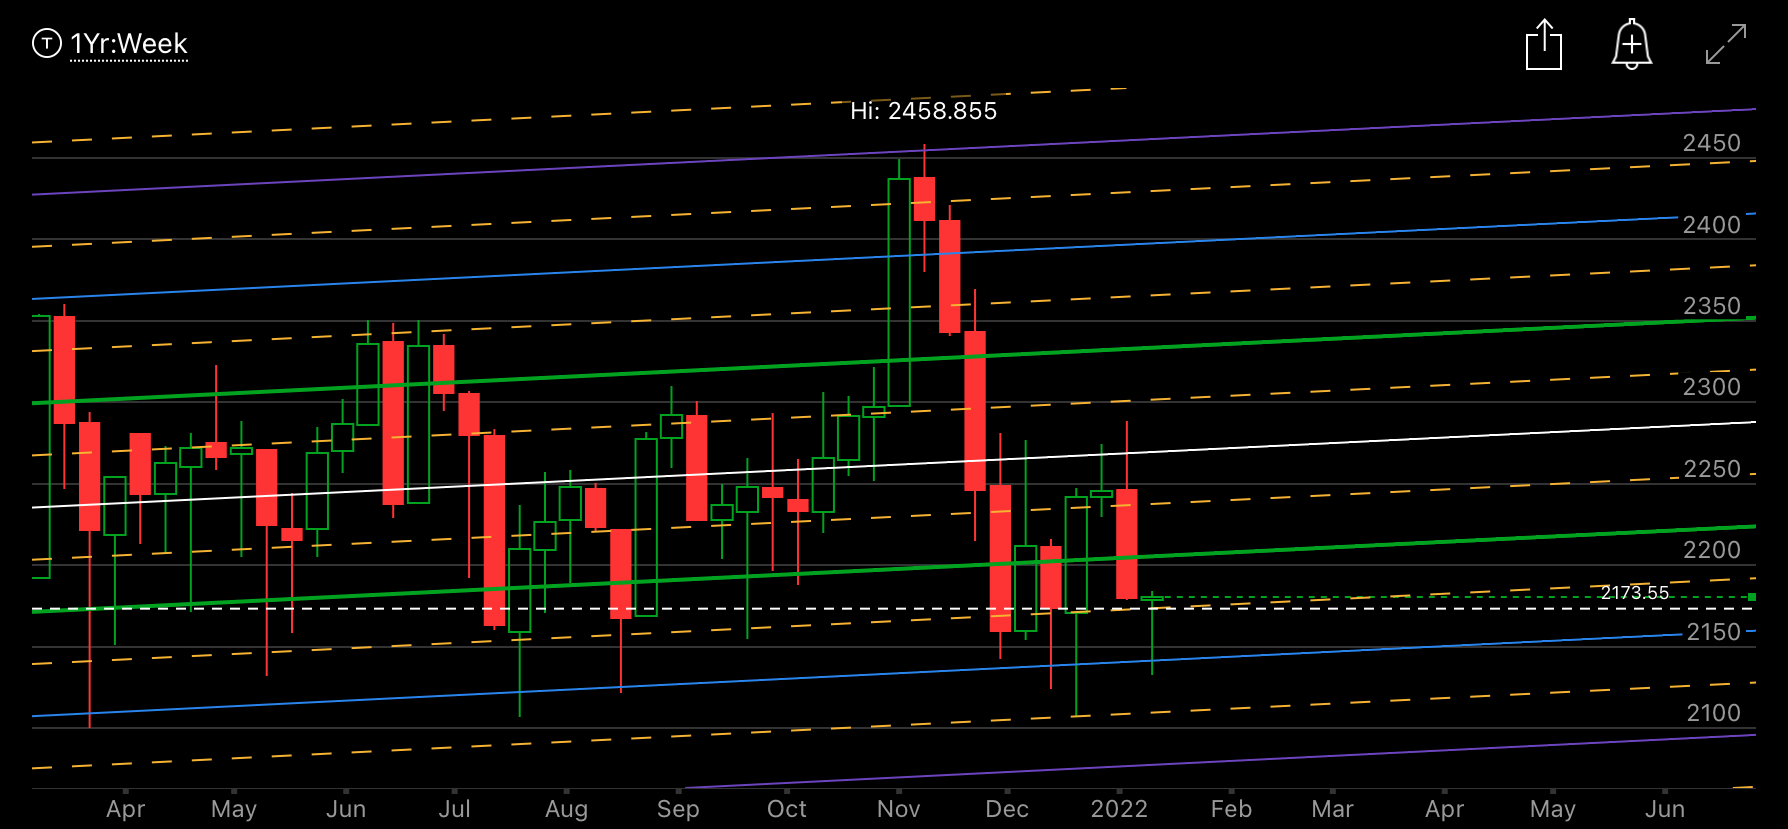
- Unlike the $DJI, the Russell Index 2000 doesn't seem to know which way is up.
- It seems to be bouncing off the second standard deviation.
- An investor can stay away from this puppy for now.
SPX
S&P 500 Index
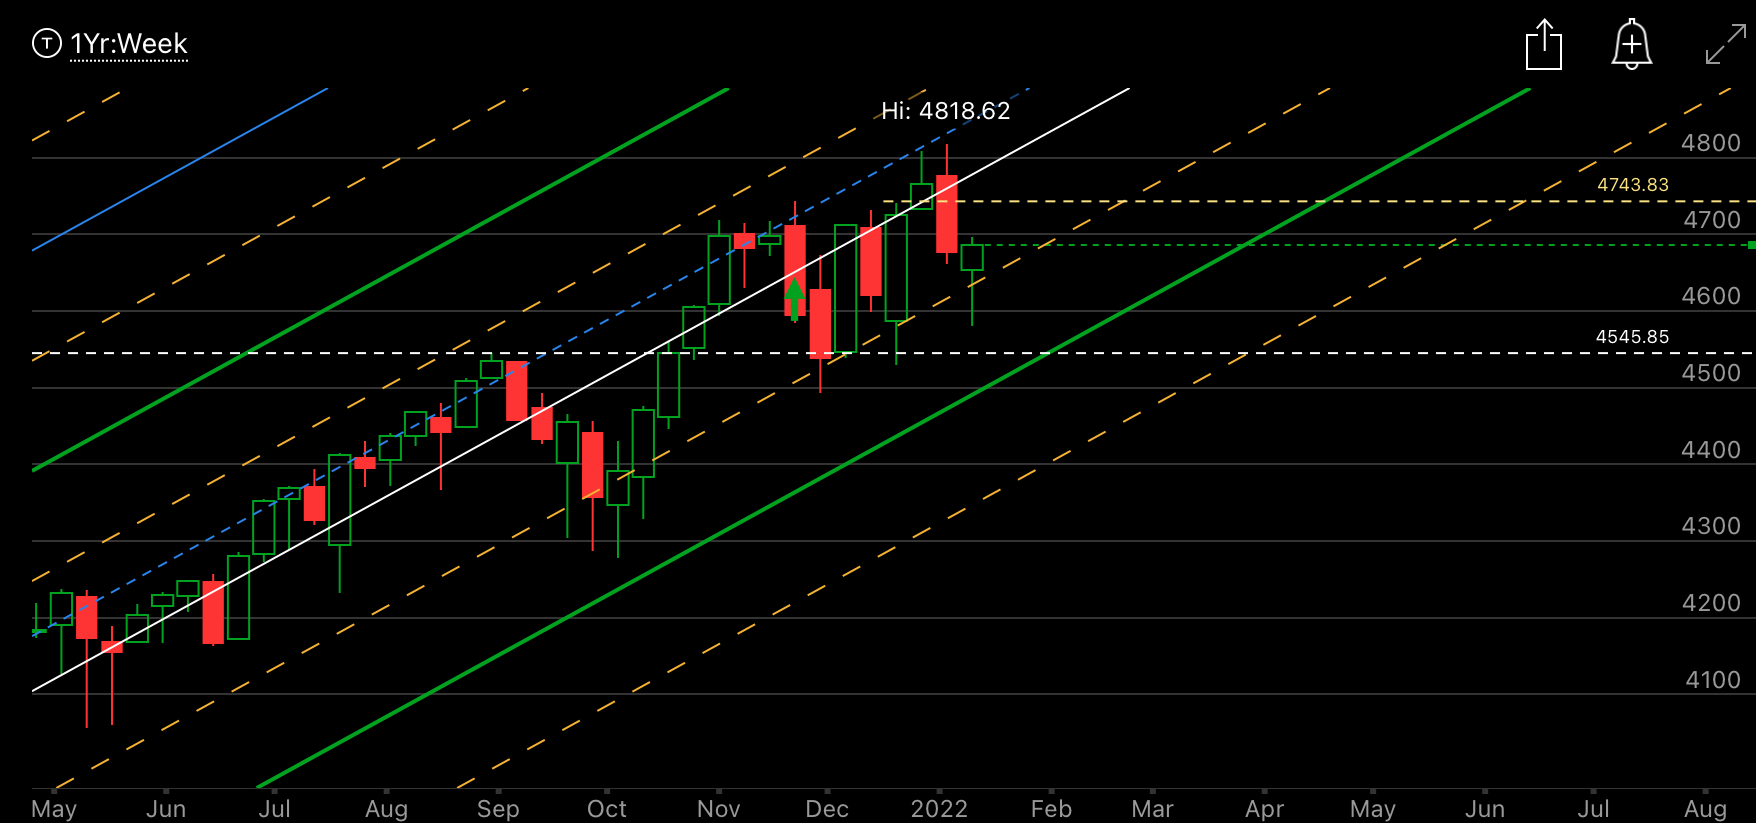
- $SPY is far away from the long term support of 4545.85.
- An investor can speculate, it may be bouncing off the 4600 level.
- An investor can play a credit put spread; just need to ensure to find the right balance of deltas and premiums.
Disclaimer: I am not a professional investment adviser and my opinions are based on my own technical analysis. Please consult an investment professional before making investment decisions.


Member discussion